Assembly Metrics per Reference
The per reference metrics can be accessed for each sample in the dropdown menu. In addition to the global metrics, the name of each reference is available in the dropdown.
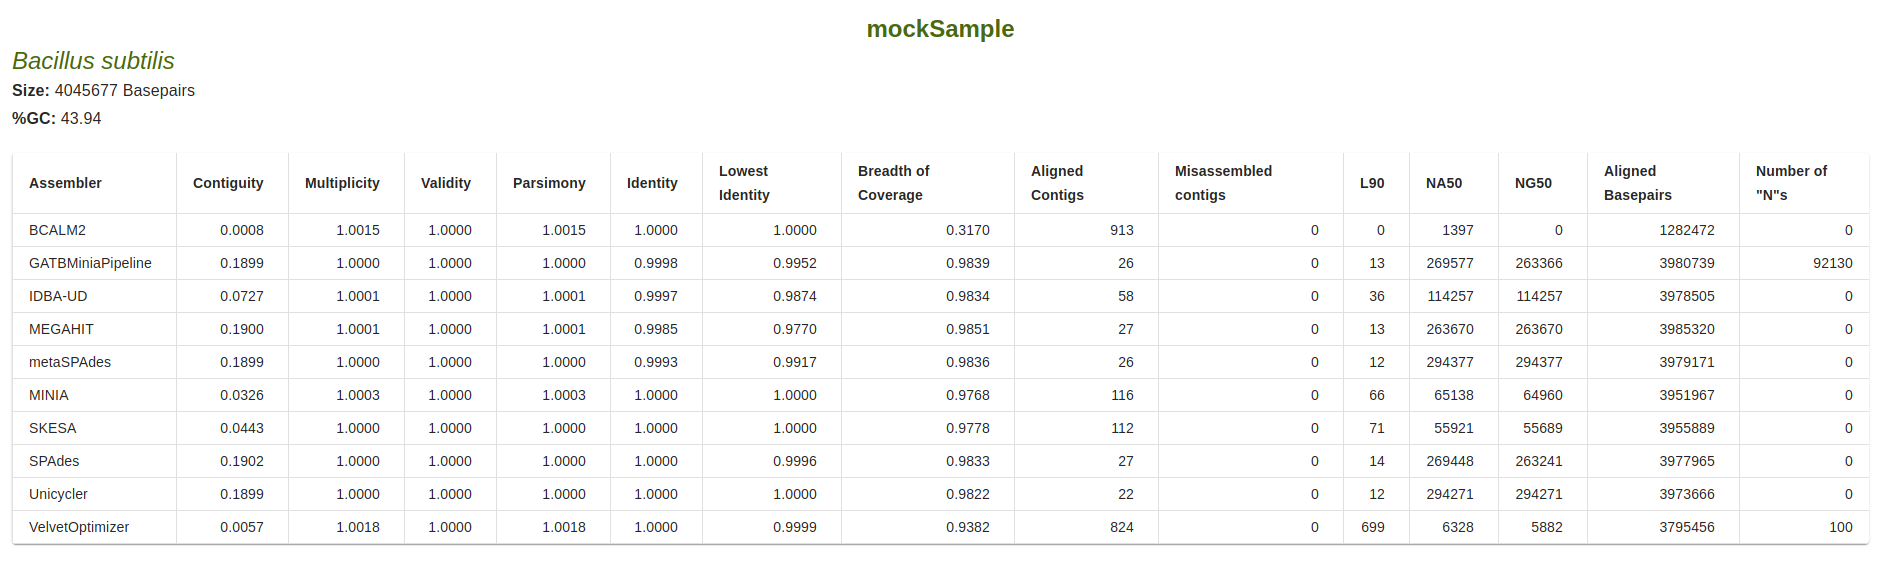
Information on the reference is available, including the name, size in basepairs and percentage of GC content.
Table of Metrics
For each assembler, the following metrics are shown in relation to the sequences produced by the assembler that
aligned to the reference sequence: Contiguity, Multiplicity, Validity, Parsimony, Identity, Lowest identity,
Breadth of coverage, Align contigs, Misassembled contigs, Lx, NAx, NGx, Aligned Basepairs and Number of “N”s.
Target value for the Lx metric is defined by the``–l_target`` parameter (defaul: 0.9).
The target value for the NAx and NGx metrics is defined by the``–n_target`` parameter (defaul: 0.5).
Metric definitions are available when mousehover the column titles or, alternatively, in the Metrics section of this documentation.
If any sequences produced by an assembler fail to align to the reference, a red check mark is shown in the table.
Reference Plots
The following plots are displayed for the assembly metrics per reference: Genome fragmentation, Lx Metric,
NAx Metric, MGx Metric, PLS Metric, Gaps and SNPs.
These metrics are calculated for the contigs over x basepairs in size, as defined by the minimum contig size
in the --minLength parameter, that map to the reference sequence.
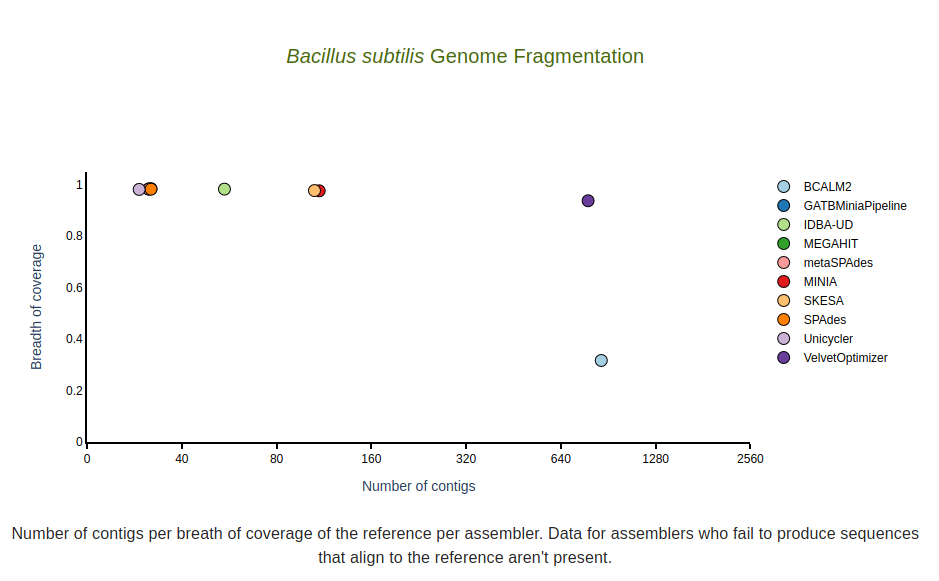
Genome fragmentation
Number of contigs (x-axis) per breadth of coverage (y-axis) per assembler for the reference sequence. Data for assemblers who fail to produce sequences that align to the reference sequence aren’t shown.
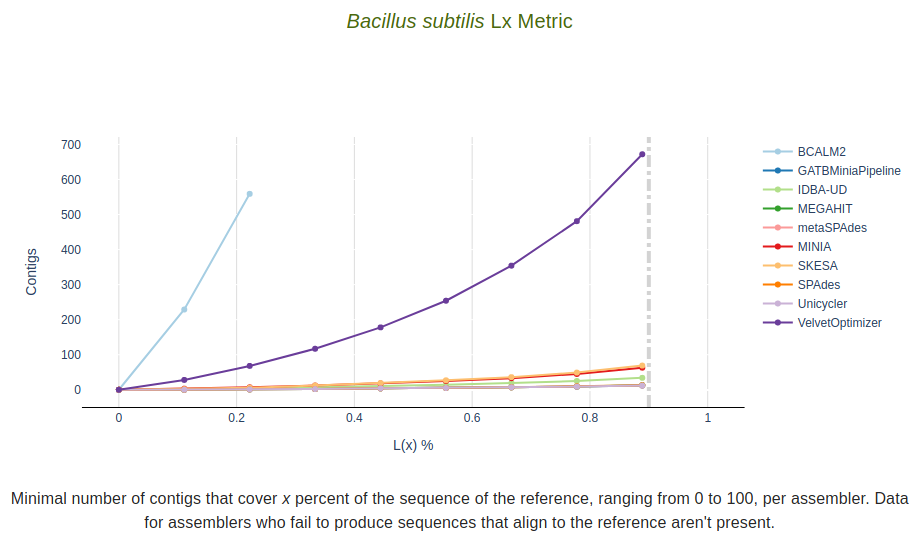
Lx Metric
Minimal number of contigs that align to the reference sequence that cover x percent of the
sequence of the reference, ranging from 0 to 100, per assembler.
Data for assemblers who fail to produce sequences that align to the reference aren’t present.
The dashed vertical line represents the target value defined in the --l_target parameter.
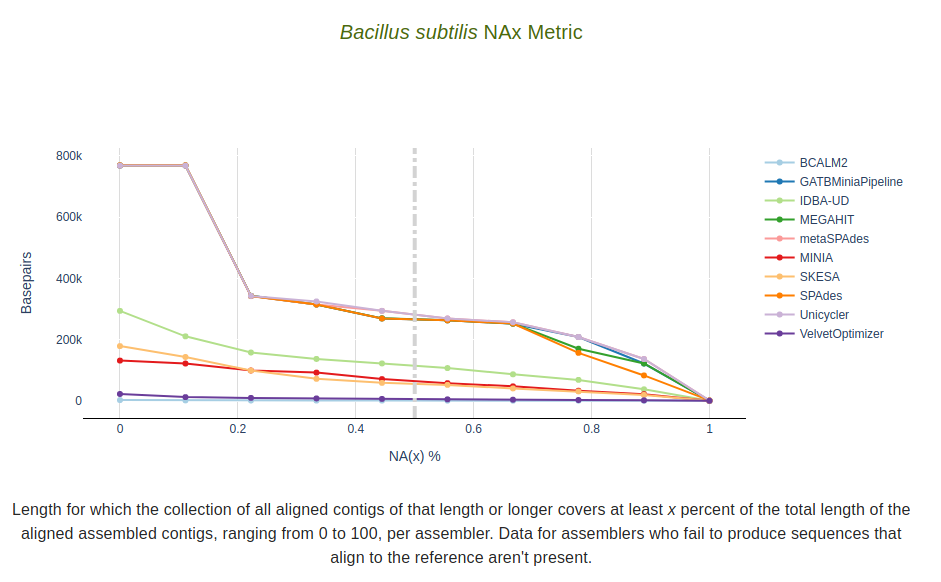
NAx Metric
Length for which the collection of all aligned contigs of that length or longer covers at least x percent of
the total length of the aligned assembled contigs, ranging from 0 to 100, per assembler.
Data for assemblers who fail to produce sequences that align to the reference aren’t present.
The dashed vertical line represents the target value defined in the --n_target parameter.
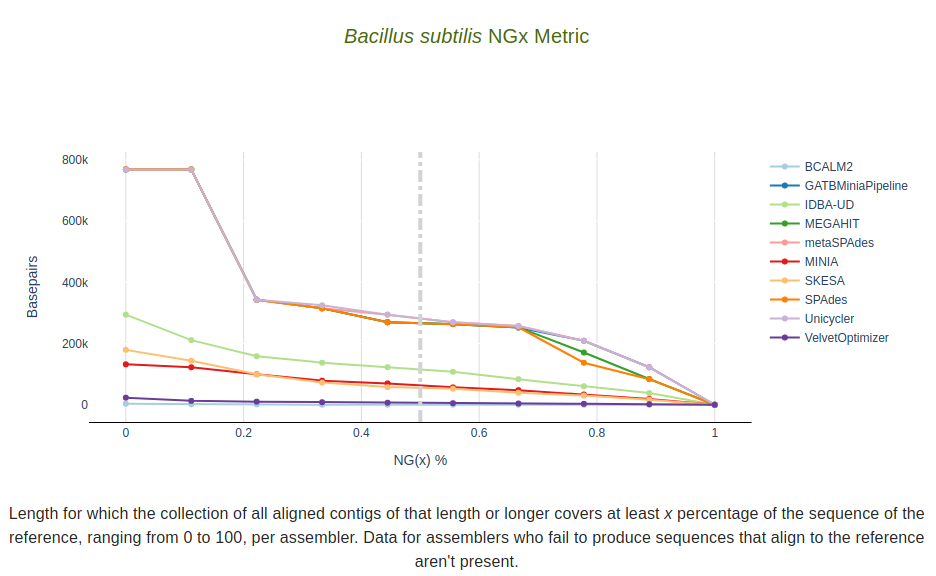
NGx Metric
Length for which the collection of all aligned contigs of that length or longer covers at least x percentage
of the sequence of the reference, ranging from 0 to 100, per assembler.
Data for assemblers who fail to produce sequences that align to the reference aren’t present.
The dashed vertical line represents the target value defined in the --n_target parameter.
PLS
Phred-like score per contig, per assembler. Data for assemblers who fail to produce sequences that align to the reference aren’t present.

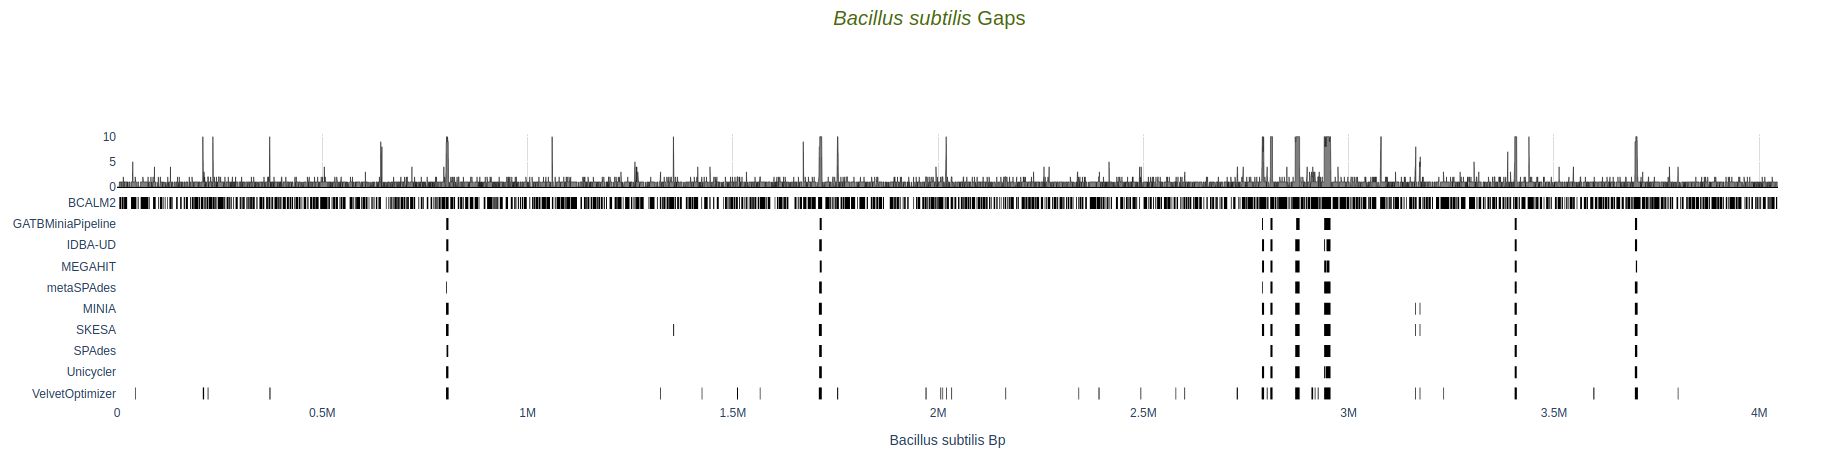
Gaps
Location of gaps in comparison to the reference sequence, per assembler. Length of gap, in basepairs, is available as hover text. The top plot represents the histogram of the cumulative number of gaps per position in the reference.
Data for assemblers who fail to produce sequences that align to the reference aren’t present.
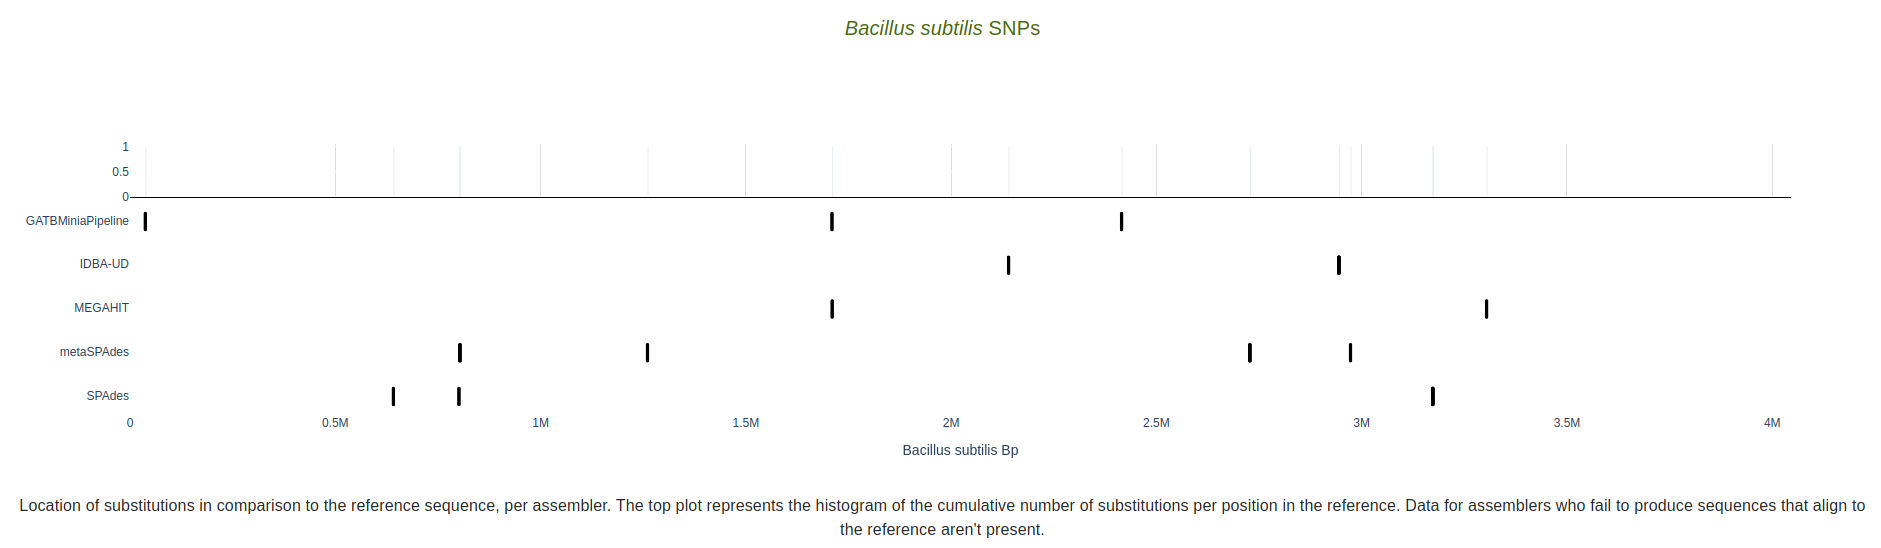
SNPs
Location of substitutions in comparison to the reference sequence, per assembler. Substitution type and coordinate is available as hover text. The top plot represents the histogram of the cumulative number of substitutions per position in the reference.
Data for assemblers who fail to produce sequences that align to the reference aren’t present.