Global Assembly Metrics
The global metrics can be accessed for each sample in the dropdown menu. This is the option shown in the report by default.
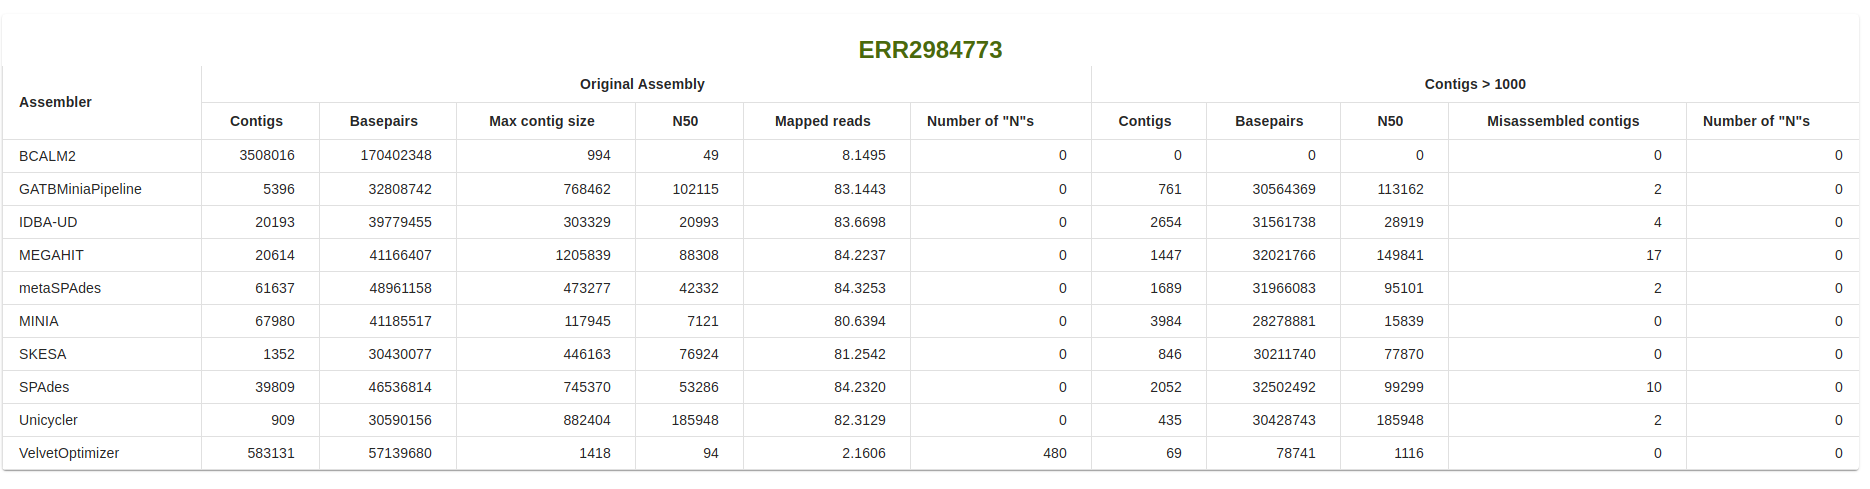
Table of Metrics
The global table is divided into two sections: Original Assembly and Contigs > X.
The X in the Contigs > X section corresponds to the minimum contig size as defined in the --minLength parameter.
The same metrics are presented for both sections per assembler: Contigs, Basepairs, Nx and Number of “N”s.
Target value for the Nx metric is defined by the --n_target parameter (default: 0.5). The exceptions are Max contig size
and Mapped reads, shown for the Original Assembly, and Misassembled contigs shown for the Contigs > X section.
Metric definitions are available when mousehover the column titles or, alternatively, in the Metrics section of this documentation.
Global Plots
The following plots are displayed for the global assembly metrics: Contig size distripution per assembler, Gap size distribution
per assembler and Misassembled contigs. These metrics are calculated for the contigs over x basepairs in size, as defined
by the minimum contig size in the --minLength parameter.
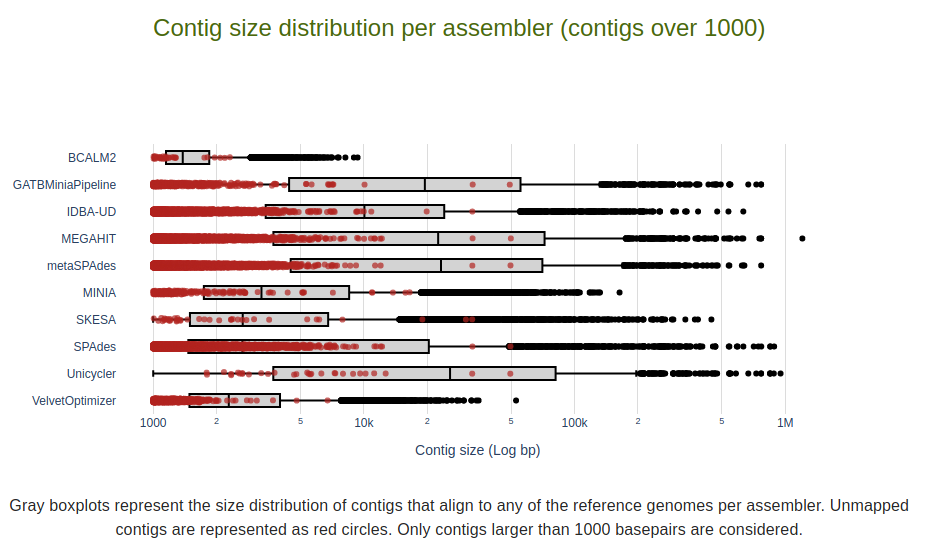
Contig size distripution per assembler
For each assembler in LMAS, a gray boxplot is created representing the size distribution of contigs that align to any of the reference genomes. Outliers are shown as black dots.
Unmapped contigs are represented as red circles. Size is contigs, in basepairs, is available as hover text.
Only contigs larger than x basepairs are considered, as defined by the minimum contig size in the --minLength parameter.
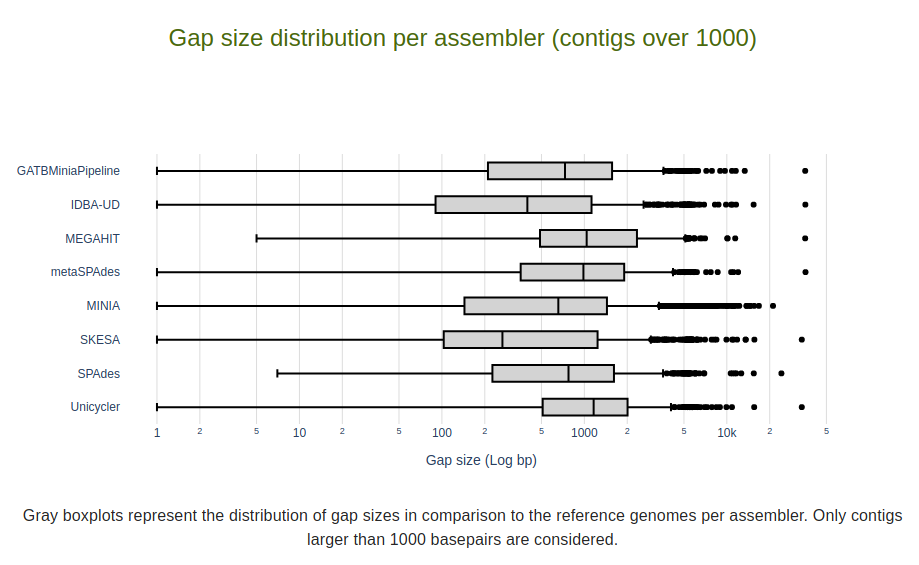
Gap size distripution per assembler
Similar to the Contig size distripution per assembler plot, the gap size distribution for each assembler is represented as a gray boxplot. Outliers are shown as back dots.
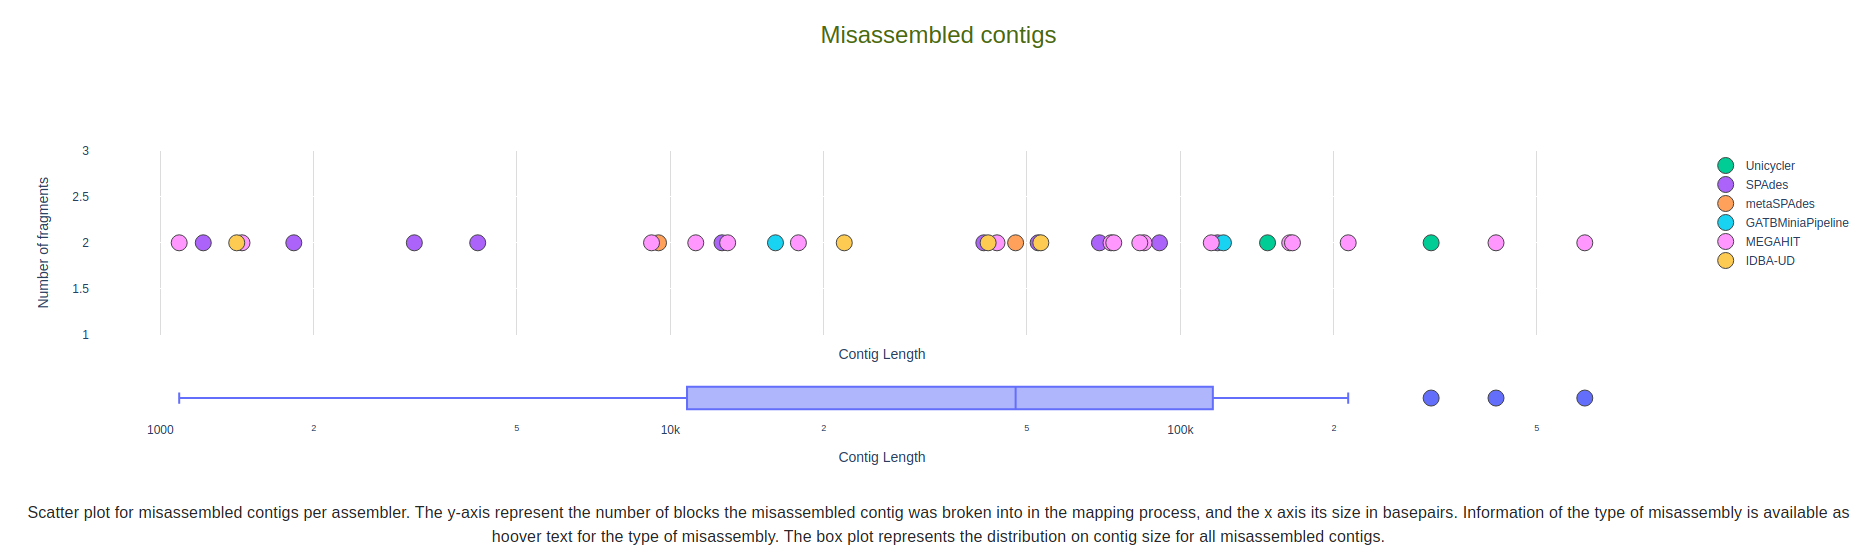
Misassembed contigs
This is a combination plot of the misassembled contigs and their size distribution, per assembler. The top plot contains a scatter plot of the misassembed contigs. The y-axis represent the number of blocks the misassembled contig was broken into in the mapping process. The x-axis its size in basepairs. Information of the type of misassembly is available as hover text for the type of misassembly: insertion, inversion, missense, chimera, translocation.
The bottom plot box plot represents the distribution on contig size for all misassembled contigs. Outliers are shown as circles.