Metrics
Global Metrics
Global Table Metrics
Global table metrics are presented both for the Original Assembly and the Filtered Assembly.
Assemblies are filtered by a minimum contig size, defined in the --minLength parameter.
General contig information
Contigs: Total number of contigs in the assembly;
Basepairs: Total number of basepairs in the assembly;
Maximum contig size: The length, in basepairs, of the largest contig in the assembly;
‘N’s: Number of uncalled bases;
Mapped reads: Percentage of mapped reads to an assembly (A read is considered mapped if at least x % of the read sequence aligns to a contig in the assembly, as defined in the
--mapped_reads_thresholdparameter);
Contiguity
Nx (where 0 < x ⩽ 100): Length for which the collection of all assembled sequences of that length or longer in an assembly covers at least a given percentage of the total length of the assembly (Default target value of 50%);
Misassemblies
Misassembled contigs: Number of missassembled contigs;
Misassembly events: Number of misassembly events in the assembly;
Global Plot Metrics
Global plot metrics are presented for the Filtered Assembly.
Assemblies are filtered by a minimum contig size, defined in the --minLength parameter.
General contig information
Contig size distribution per assembler: For each assembler in LMAS, a boxplot is computed representing the size distribution of contigs that align to any of the reference replicons. The unmapped contigs, if present, are represented in a red scatterplot overlapping the boxplot.
Gap size distribution per assembler: For each assembler in LMAS, a boxplot is computed representing the distribution of gap sizes. Gaps are calculated in relation to the assembled sequences that align to any of the reference replicons, with 1 basepair or more in length.
Misassemblies
Misassembled contigs: Scatter plot for misassembled contigs per assembler, the size of the misassembled contigs, and the number of breakpoint events. The distribution on contig size for all misassembled contigs is represented in a boxplot. The type of misassembly is presented as hoover text for each misassembly event.
The following misassembly types are identified:
Chimera: a contig has two or more sequence blocks mapping to different reference replicons;
Insertion: a sequence block (≥50 basepairs) which is not present in any of the reference replicons has been introduced into the contig by the assembly process;
Deletion: a sequence block (≥50 basepairs) of the reference replicon is missing from the contig created by the assembly process;
Inversion: a contig has at least two sequence blocks mapping to the same replicon but reversed end to end, i.e. one of the blocks maps to the sense strand and the other to the antisense strand in the reference while both are in the same strand in the contig, or vice-versa;
Rearrangement: a contig has at least two sequence blocks mapping to the same replicon, in the same orientation, in a different order than in the reference sequence;
Translocation: a contig has at least two sequence blocks abutting in the contig but mapping non-collinearly (over 1000 base pairs apart) to the reference replicon;
Duplication: a sequence block of a contig maps at least twice to the reference replicon in different alignment blocks;
Inconsistency: a contig has at least two sequence blocks abutting in the contig but fails to be classified in any of the previous categories.
Per Reference Metrics
Metrics per reference are calculated with minimap2 mapping results between the the Filtered Assembly and the reference sequences.
Assemblies are filtered by a minimum contig size, defined in the --minLength parameter.
Reference Table Metrics
General contig information
Contigs: The total number of contigs in the assembly that align to the reference replicon;
Basepairs: The total number of bases in the assembly that align to the reference replicon;
Number of ‘N’s: Number of uncalled bases (N’s) in the contigs that align to the reference replicon.
COMPASS
Implemented as defined by Bradnam et al, 2013, the COMPASS is a set of metrics defining how much of the reference is covered by alignments of contigs.
Breadth of Coverage: Ratio of covered sequence on the reference by aligned contigs;
Multiplicity: Ratio of the length of alignable assembled sequence to covered sequence on the reference;
Validity: Ratio of the length of the alignable assembled sequence to total basepairs in the aligned contigs;
Parsimony: Cost of the assembly (multiplicity over validity);
Contiguity
LSA: longest single alignment between the assembly and the reference, relative to the reference length;
NAx (where 0 < x ⩽ 100): Length for which the collection of aligned assembled sequences of that length or longer in an assembly covers at least a given percentage of the total length of the reference replicon;
NGx (where 0 < x ⩽ 100): Length for which the collection of aligned contigs of that length or longer covers at least a given percentage of the sequence of the reference.
Lx (where 0 < x ⩽ 100): Minimal number of contigs that cover x % of the sequence of the reference;
Identity
Identity: Ratio of identical basepairs in all aligned contigs to the reference;
Lowest identity: Identity of the lowest scoring contig to the reference.
Misassembly
Misassembled contigs: Number of aligned contigs that contain a misassembly event;
Misassembly events: Number of misassembly events in the aligned contigs;
Reference Plot Metrics
Data for assemblers who fail to produce sequences that align to the reference aren’t present in the plots.
COMPASS
Genome Fragmentation: Scatter plot representing the number of contigs per breadth of coverage of the reference, per assembler.
Contiguity
NAx (where 0 < x ⩽ 100): Line plot of the length for which the collection of all aligned contigs of that length or longer covers at least x % of the total length of the aligned assembled contigs, from 0 to 100%;
NGx (where 0 < x ⩽ 100): Line plot for the length for which the collection of all aligned contigs of that length or longer covers at least x % of the sequence of the reference, from 0 to 100%;
Lx (where 0 < x ⩽ 100): Line plot for minimal number of contigs (L Metric) that cover the sequence of the reference, from 0 to 100%;
Identity
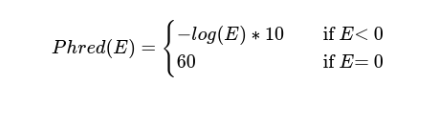
Pls Metric: Scatter plot for the Phred-like score per contig, per assembler;
Gaps: Location of gaps in comparison to the reference sequence, per assembler, with the cumulative number of gaps per position in the reference. Gaps with 1 basepair or more in length are considered;
SNPs: Location of substitutions in comparison to the reference sequence, per assembler, with the indication of the substitution type and coordinate in the reference. Additionally, the cumulative number of SNPs per position in the reference is presented;
The Pls or Phred-like score is a scoring function based on the identity of each aligned contig to the reference replicon. For each contig, it is obtained as following: